Formatting the Data
Last updated on 2025-07-01 | Edit this page
Estimated time: 20 minutes
Overview
Questions
- What do the
pivot_longer()andfull_join()functions do?
Objectives
- Explore how to convert data frames from wide to long format
- Join two data frames using column names
Converting from wide to long format
We will first convert the data from wide format into long format to
make it easier to work with and so that we can plot the data with the
ggplot2 package.
Instead of multiple columns with counts for each sample, we just want one column containing all the expression values, as shown below:
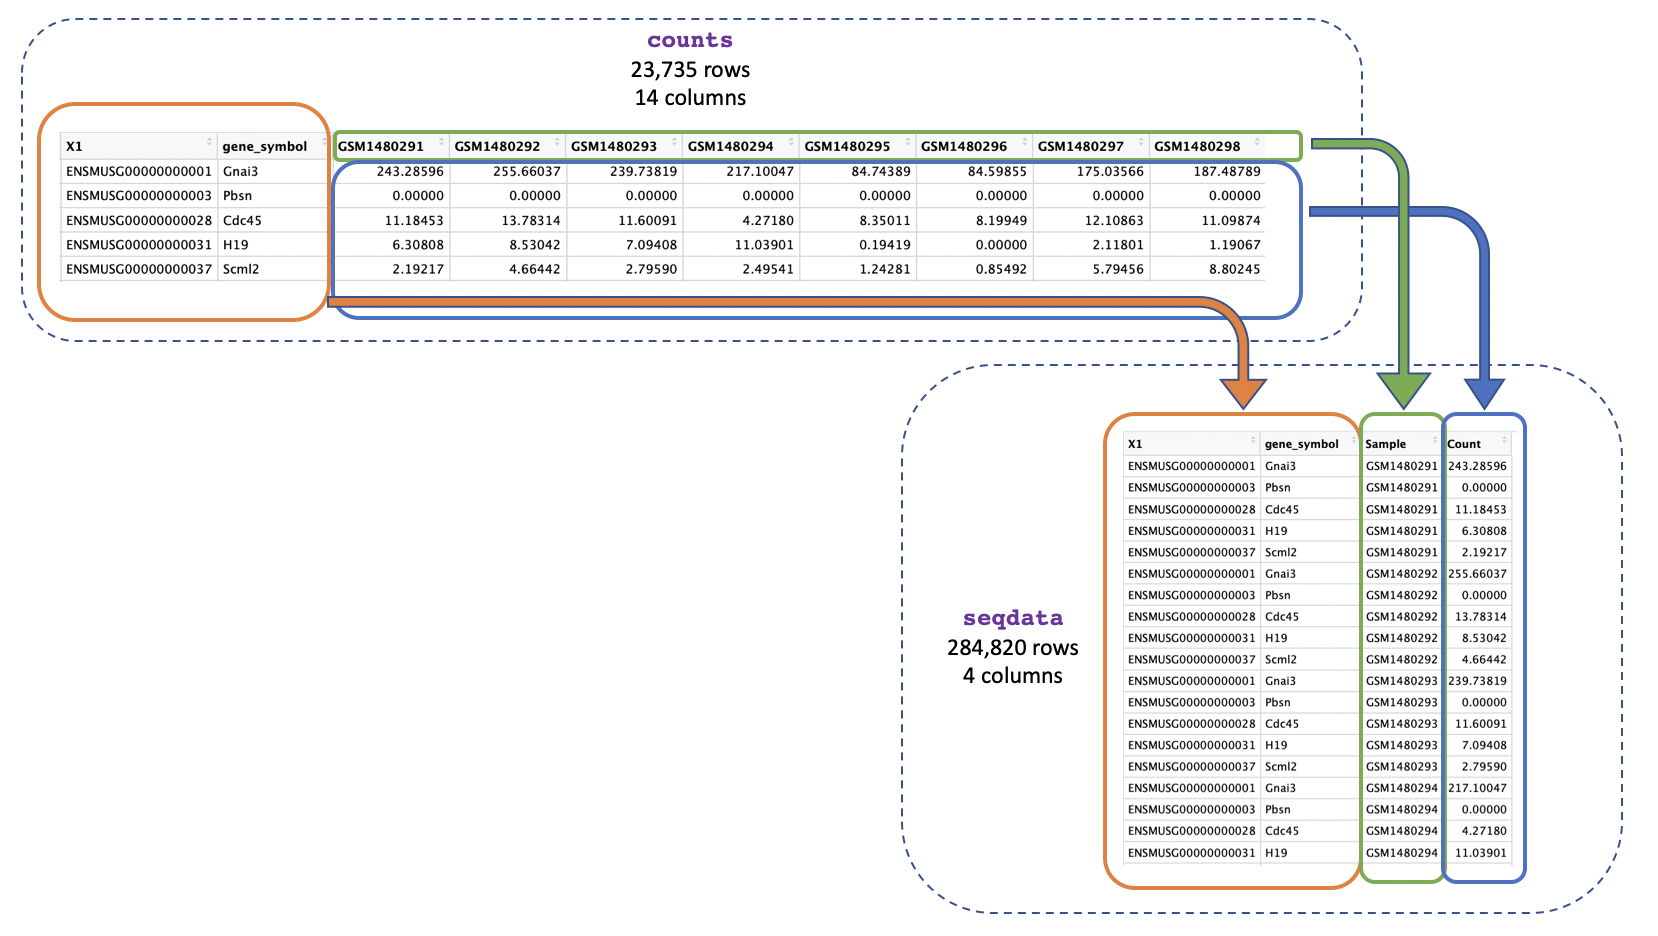
We can use pivot_longer() to easily change the format
into long format.
Your turn 3.1
Find out what pivot_longer() does and how to use it
R
?pivot_longer
Your turn 3.2
Convert the counts data into long format and save it as a new object
called seqdata
R
seqdata <- pivot_longer(counts, cols = starts_with("GSM"),
                        names_to = "Sample", values_to = "Count")
We use cols = starts_with("GSM") to tell the function we
want to reformat the columns whose names start with “GSM” (these columns
are the ones where we have the gene counts). pivot_longer()
will then reformat the specified columns into two new columns, which
we’re naming “Sample” and “Count”. The names_to = "Sample"
specifies that we want the new column containing the columns to be named
“Sample”, and the values_to = "Count" specifies that we
want the new column containing the values to be named “Count”.
As explained earlier, in R there is often more than one way to do the
same thing. We could get the same result by specifying the argument
cols in a different way. For example, instead of using
starts_with we could use a range like the one you used in
the previous section.
Your turn 3.3
Convert the counts data into long format using a column range
R
seqdata <- pivot_longer(counts, cols = GSM1480291:GSM1480302,
                        names_to = "Sample", values_to = "Count")
Another way we could do the same thing is by specifying the columns
we do not want to reformat, this will tell
pivot_longer() to reformat all the other columns. To do
that we put a minus sign “-” in front of the column
names that we don’t want to reformat. This is a pretty common way to use
pivot_longer() as sometimes it is easier to exclude columns
we don’t want than include columns we do. The command below would give
us the same result as the previous command.
Your turn 3.4
Convert the counts data into long format by specifying which columns not to convert
R
seqdata <- pivot_longer(counts, cols = -c("gene_id", "gene_symbol"),
                        names_to = "Sample", values_to = "Count")
Your turn 3.5
Type each command line above, then look at the data, are all three of
the seqdata objects you made the same?
All three seqdata objects are the same, as we did the
same conversion from wide to long format using 3 different methods.
seqdata has 284820 rows and 4 columns, and has length
4.
Joining two tables
Now that we’ve got just one column containing sample IDs in both our counts and metadata objects we can join them together using the sample IDs. This will make it easier to identify the categories for each sample (e.g. if it’s basal cell type) and to use that information in our plots.
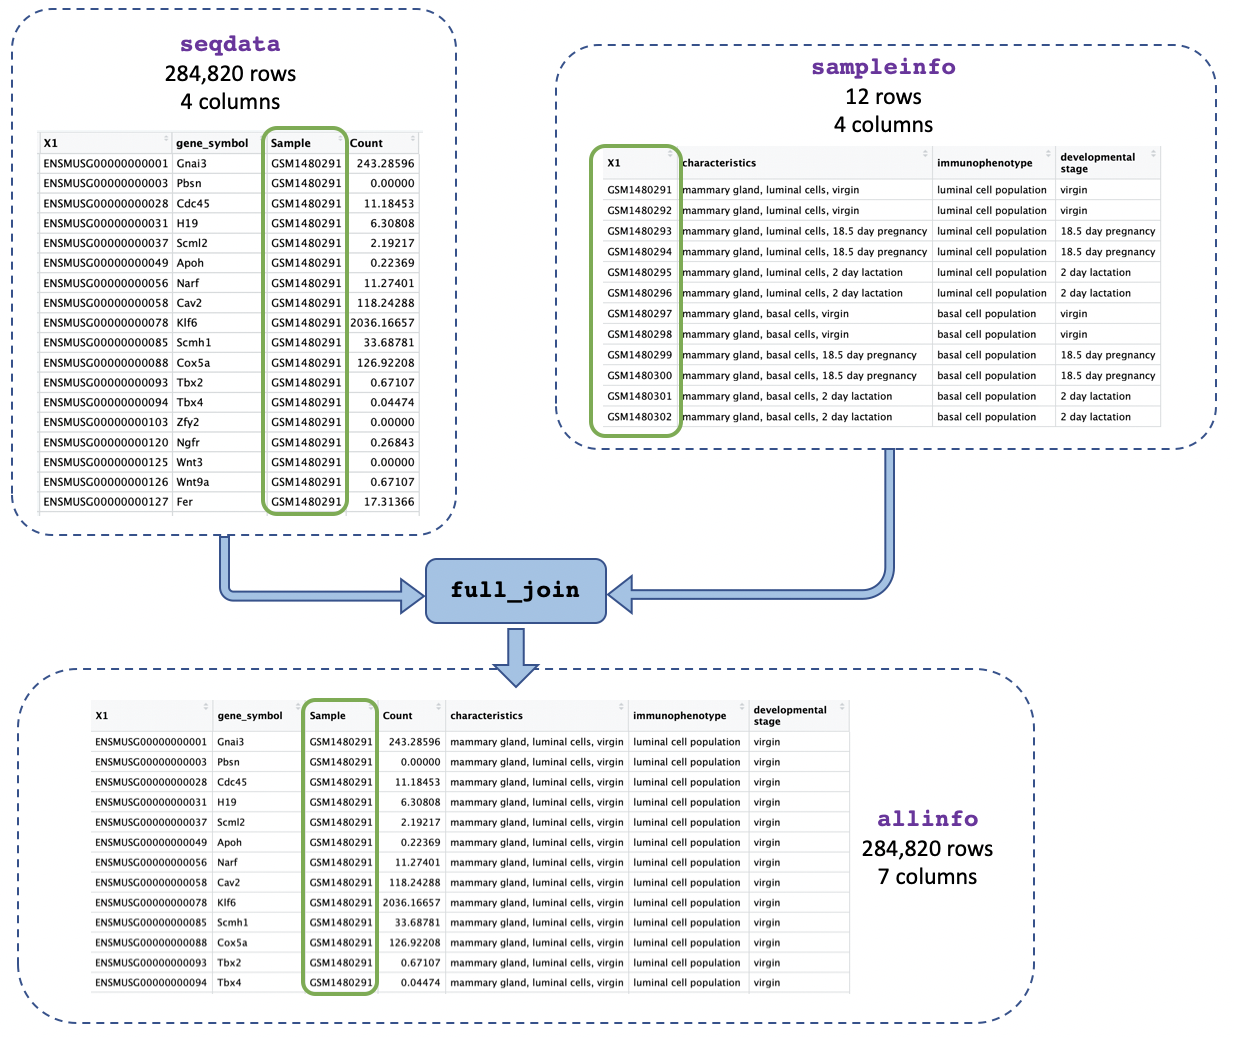
We use the function full_join() and give as arguments
the two tables we want to join. We add
by = join_by(Sample == sample_id) to say we want to join on
the column called “Sample” in the first table (seqdata) and
the column called “sample_id” in the second table
(sampleinfo) when the values match:
Your turn 3.6
Join the count data and metadata by matching sample IDs
R
allinfo <- full_join(seqdata, sampleinfo, by = join_by(Sample == sample_id))
Your turn 3.7
Have a look at the new object you generated above and see what information it includes, how many columns does it have and what does each column tell you?
R
dim(allinfo)
OUTPUT
[1] 284820 7R
colnames(allinfo)
OUTPUT
[1] "gene_id"             "gene_symbol"         "Sample"
[4] "Count"               "characteristics"     "immunophenotype"
[7] "developmental stage"
The allinfo object has 7 columns which tell you about
the gene id and symbol, the same id, gene count, and sample information
(characteristics, immunophenotype, and developmental stage).
Key Points
- The
pivot_longer()function can convert data frames from wide to long format and there are multiple ways to do this - The
full_join()function can merge two data frames. You can specify which column names should be joined by using thejoin_by()function.