Introduction to R
Figure 1
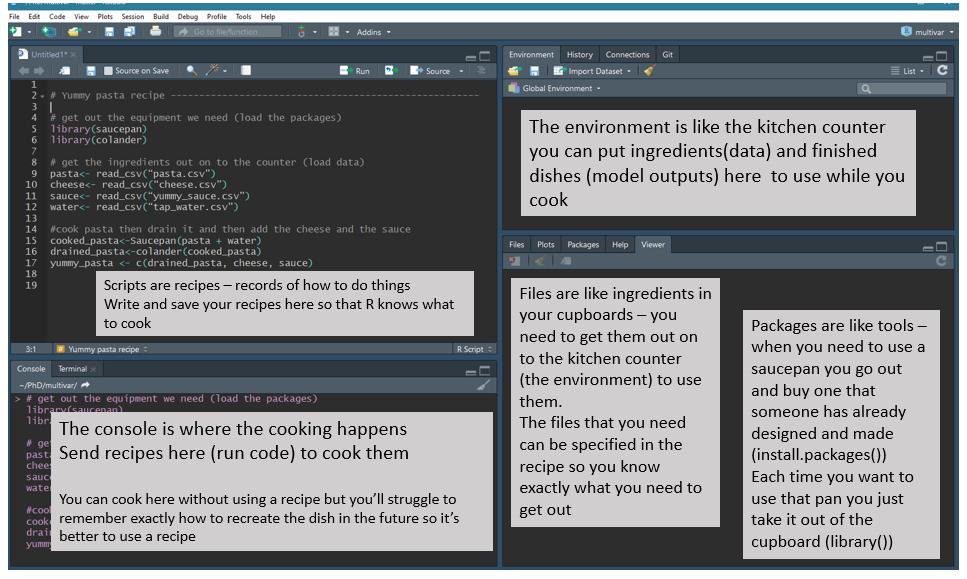
Figure 2
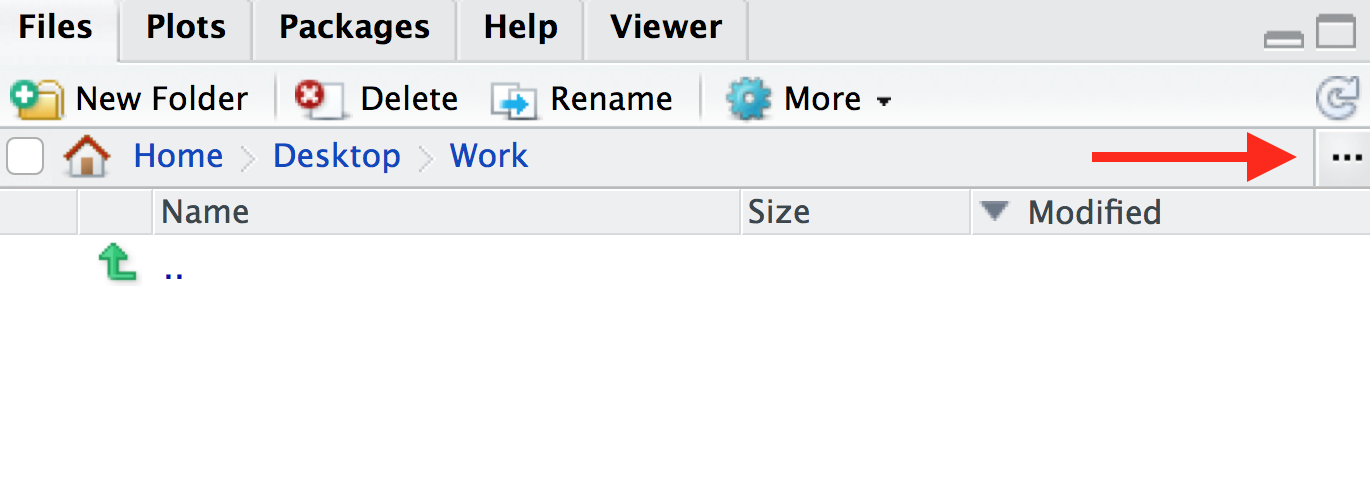
Figure 3
Exploring the Data
Figure 1
Figure 2

Figure 3
Figure 4
Figure 5
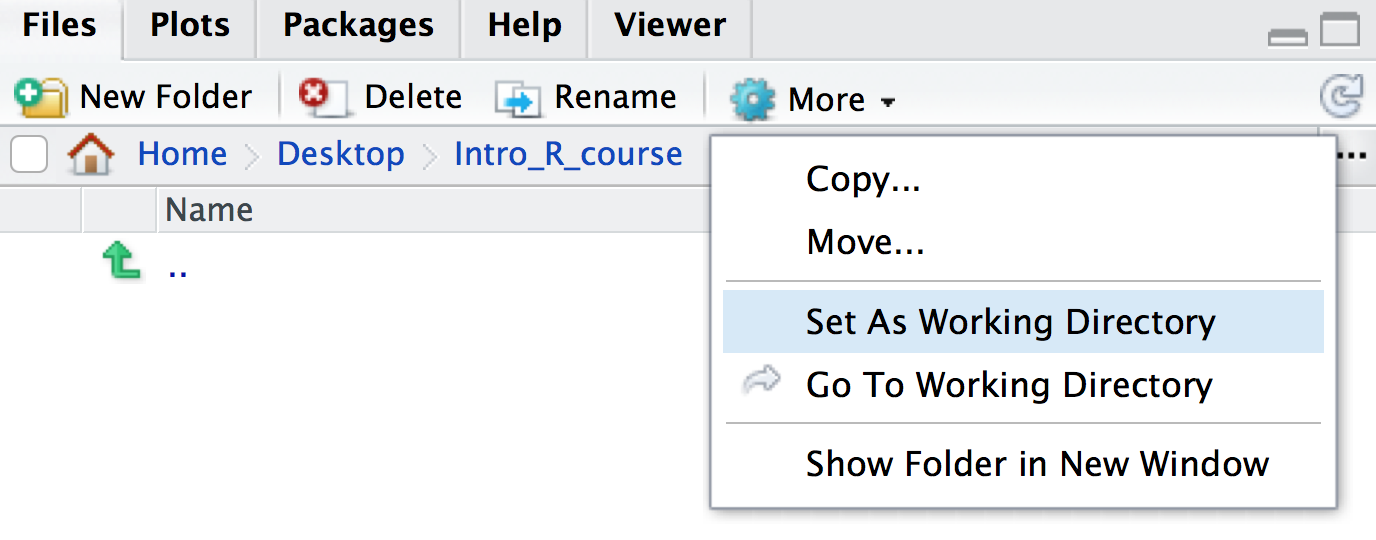
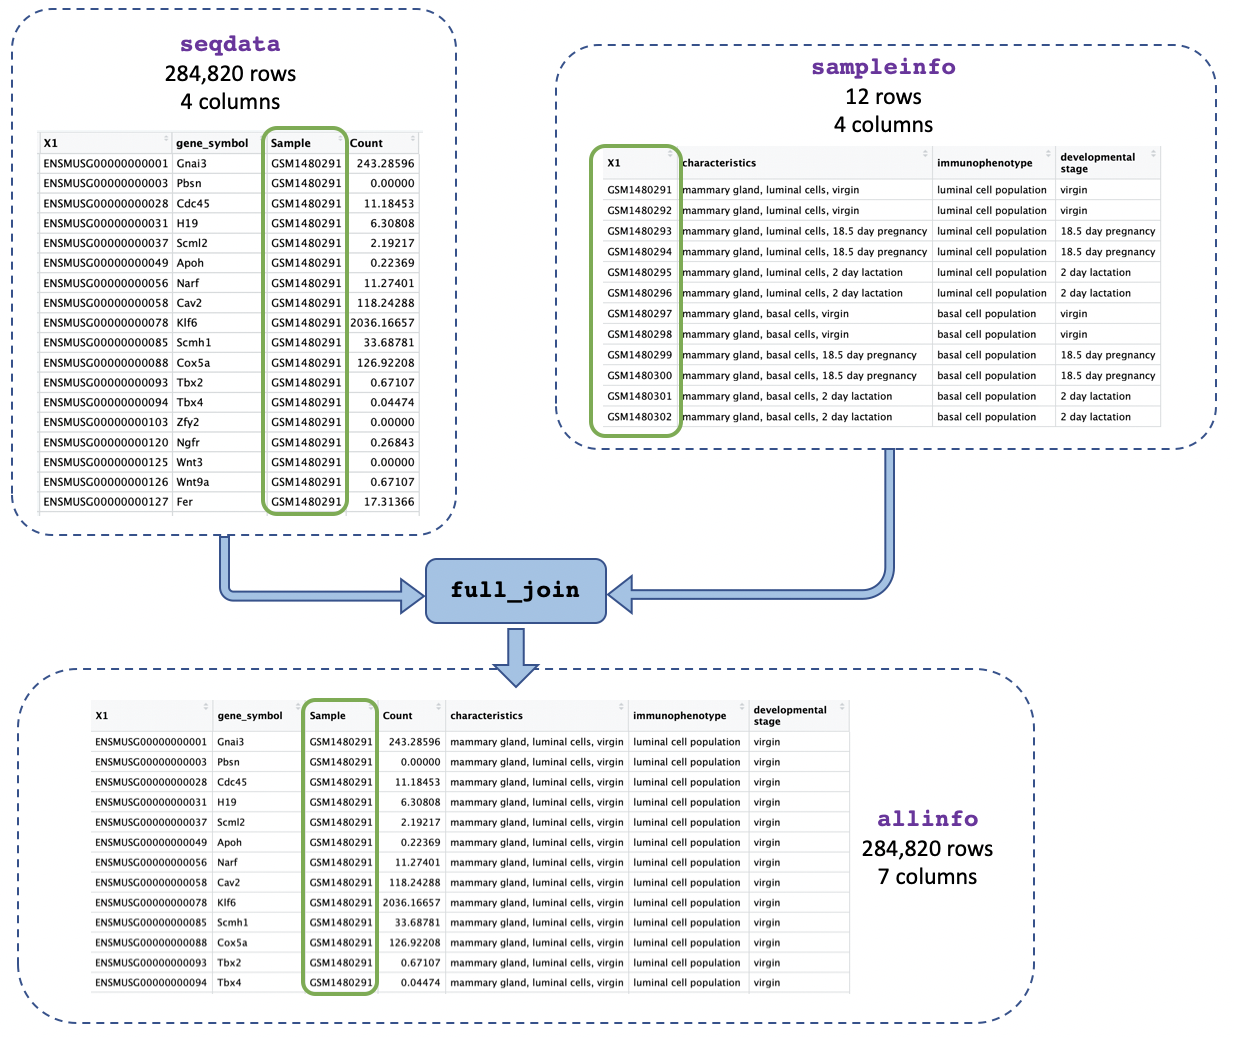
Formatting the Data
Figure 1
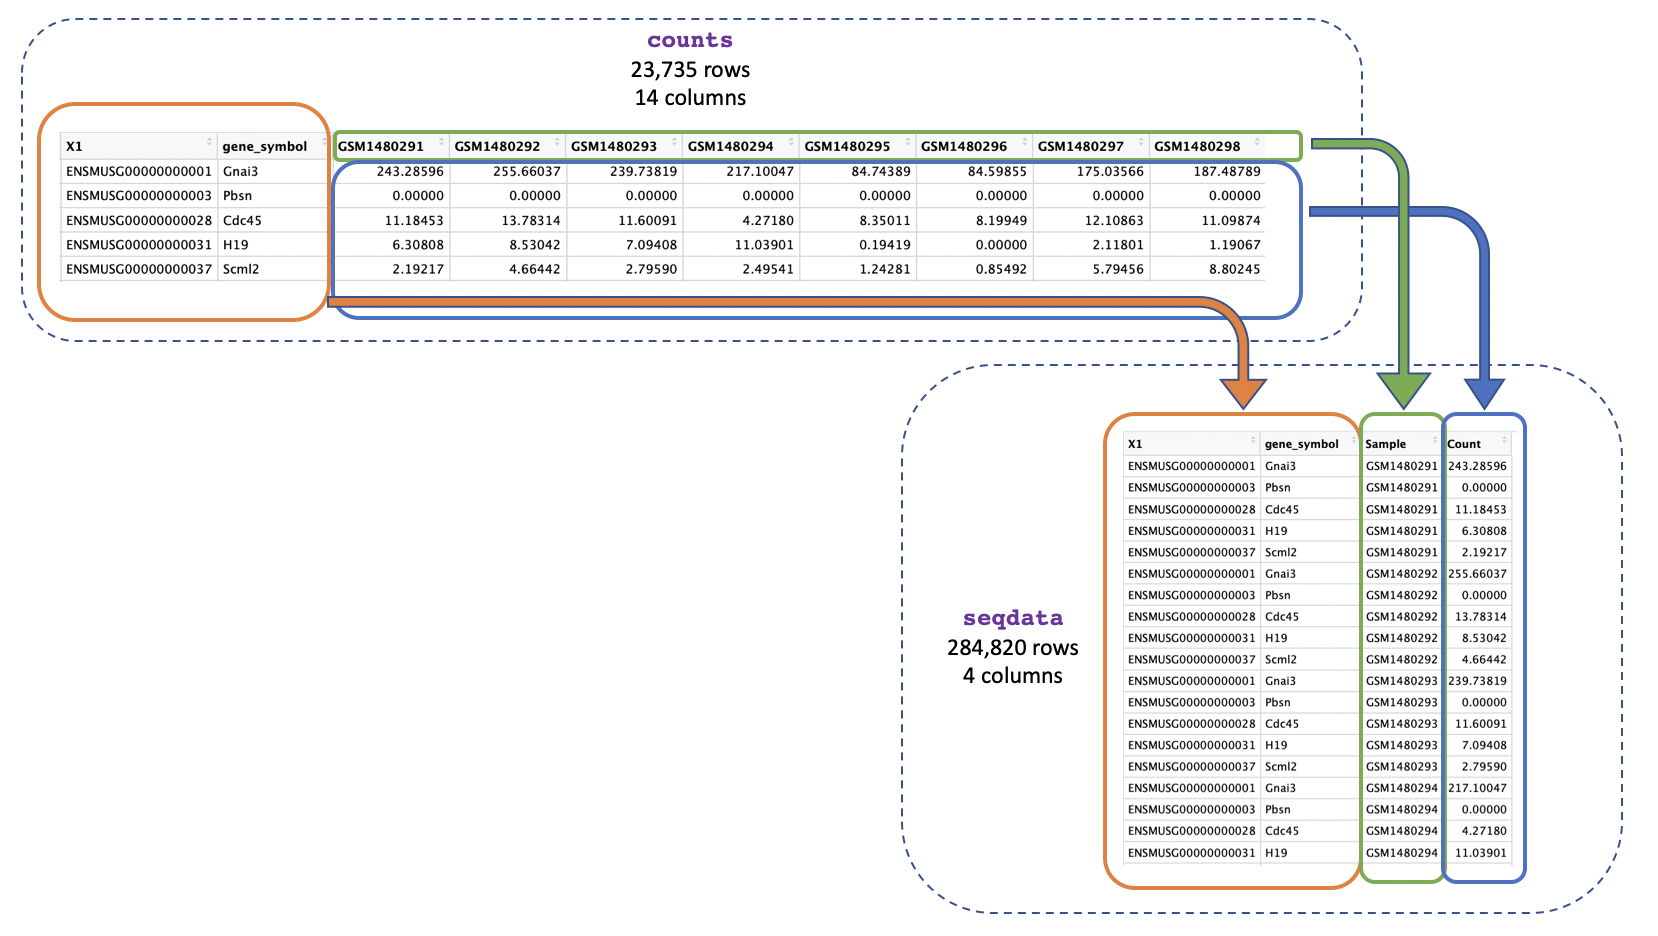
Figure 2
Introduction to ggplot2
Figure 1
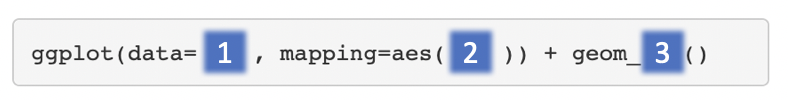
Figure 2
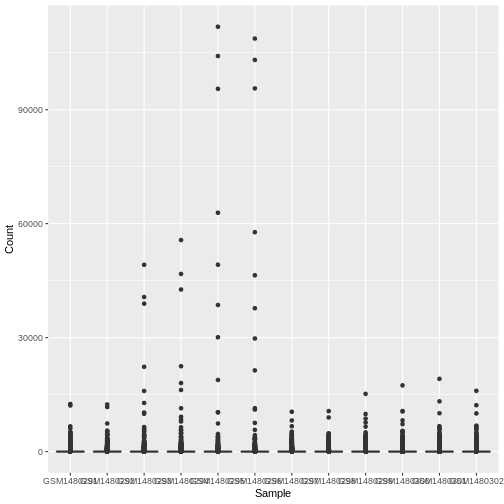
Figure 3
Figure 4
Figure 5
Figure 6
Figure 7
Figure 8
Figure 9
Figure 10

Figure 11
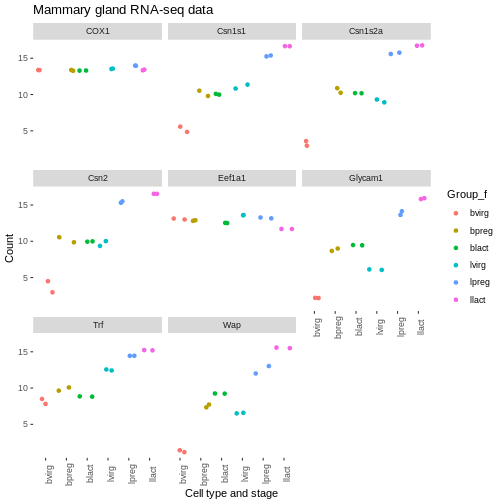
Extra ggplot2 Customisation
Figure 1
Figure 2
Figure 3
Figure 4
Figure 5
Figure 6
Figure 7
Figure 8